
Executive Summary
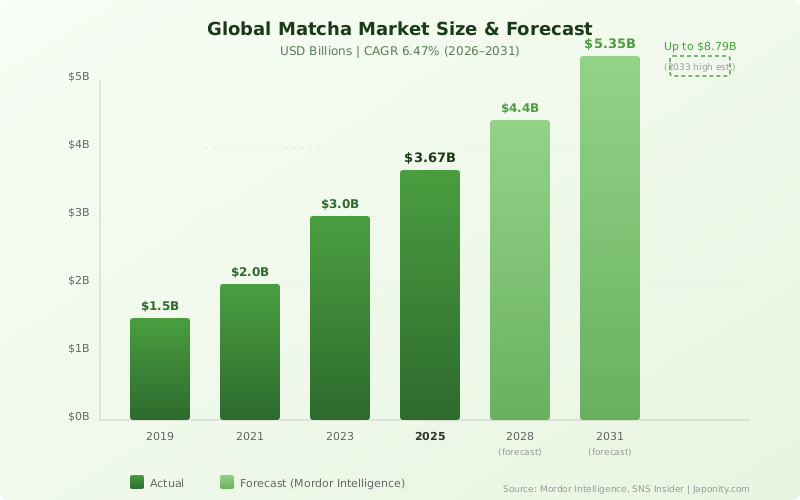
The global matcha market, valued at USD 3.67 billion in 2025, is projected to reach USD 5.35 billion by 2031 at a CAGR of 6.47%. Once a niche ceremonial ingredient, matcha has become a mainstream global commodity—driven by health-conscious consumers, social media virality, and the café culture revolution.
Yet behind the boom lies a deepening crisis: Japan’s matcha supply cannot keep pace with exploding worldwide demand. In 2025, Kyoto tencha prices surged 170%, tea farmer populations continue to decline, and major producers like Ippodo and Marukyu-Koyamaen have announced significant price increases.
This report provides the most comprehensive analysis of the global matcha market—covering market sizing, regional dynamics, supply chain challenges, scientific evidence, consumer trends, and business opportunities—backed by data from government statistics, industry reports, and peer-reviewed research.
1. What Is Matcha? Types and Grades
Matcha (抹茶) is a finely ground powder made from specially grown and processed green tea leaves called tencha (碾茶). Unlike regular green tea, matcha plants are shade-covered for 20–30 days before harvest, which boosts chlorophyll and L-theanine content, giving the powder its vibrant green color and umami-rich flavor.
The Production Process
After harvesting, tencha leaves are steamed, dried, and de-veined before being stone-ground into an ultra-fine powder using traditional granite mills. A single mill produces only about 40 grams per hour, which partly explains matcha’s premium pricing compared to other teas.
Matcha Grades
| Grade | Japanese Term | Color | Flavor | Primary Use | Price Range (per 30g) |
|---|---|---|---|---|---|
| Ceremonial | 濃茶用 (Koicha-yō) | Vibrant emerald green | Rich umami, minimal bitterness, naturally sweet | Traditional tea ceremony, drinking straight | $25–$80+ |
| Premium | 薄茶用 (Usucha-yō) | Bright green | Balanced umami with slight astringency | Daily drinking, lattes | $15–$30 |
| Culinary (Café Grade) | 加工用 (Kakō-yō) | Yellow-green | More astringent and bitter | Lattes, smoothies, baking | $8–$18 |
| Industrial | 食品加工用 (Shokuhin kakō-yō) | Dull olive-green | Strongly bitter | Mass-produced foods, ice cream, confectionery | $3–$10 |
The grading system is not officially standardized—there is no legal definition distinguishing “ceremonial” from “culinary” matcha. Quality is primarily determined by the harvest timing (first flush is highest quality), shading duration, leaf selection (young leaves only), and stone-milling method.
Key Producing Regions in Japan
| Region | Prefecture | Share of Japan’s Tencha | Characteristics |
|---|---|---|---|
| Uji | Kyoto | ~23% | 800+ year history, highest prestige, ceremonial grade specialty |
| Nishio | Aichi | ~20% | Japan’s largest matcha-producing city by volume, balanced quality-price |
| Kagoshima | Kagoshima | ~38% | Largest tencha producer since overtaking Kyoto, rapid growth area |
| Shizuoka | Shizuoka | ~12% | Japan’s largest tea prefecture overall, growing tencha share |
| Yame | Fukuoka | ~5% | Premium gyokuro region expanding into tencha |
Source: 農林水産省「茶業及びお茶の文化に係る現状と課題」(2024)
2. Global Market Size and Growth Projections
Market Valuation Across Research Firms
| Research Firm | 2025 Valuation | Forecast Year | Forecast Value | CAGR |
|---|---|---|---|---|
| Mordor Intelligence | $3.67B | 2031 | $5.35B | 6.47% |
| SNS Insider | $4.04B | 2033 | $8.79B | 10.22% |
| SkyQuest | $4.47B | 2032 | — | — |
| Future Market Insights | $3.37B | 2035 | — | 7.1% |
| Research Nester | $3.13B | 2035 | — | 5.6% |
While estimates vary due to different methodologies and market segmentation, all major research firms agree on one thing: the matcha market will at least double by the early 2030s.
Growth Rate Comparison: Matcha vs. Coffee
| Metric | Matcha | Coffee |
|---|---|---|
| Global Market (2024) | ~$3.65B | ~$223.78B |
| CAGR (2024–2030) | 7.9% | 5.3% |
| Key Growth Demographic | Gen Z, Millennials | All demographics |
| Caffeine per Cup | ~70mg | ~100–140mg |
Although matcha is still a fraction of the coffee market, its growth rate outpaces coffee by nearly 50%. According to BeverageDaily, Gen Z consumes more tea-based beverages than coffee, making matcha a potential long-term challenger in the beverage industry.
3. Regional Market Analysis
Market Share by Region (2025)
| Region | Market Share | CAGR (2026–2031) | Key Drivers |
|---|---|---|---|
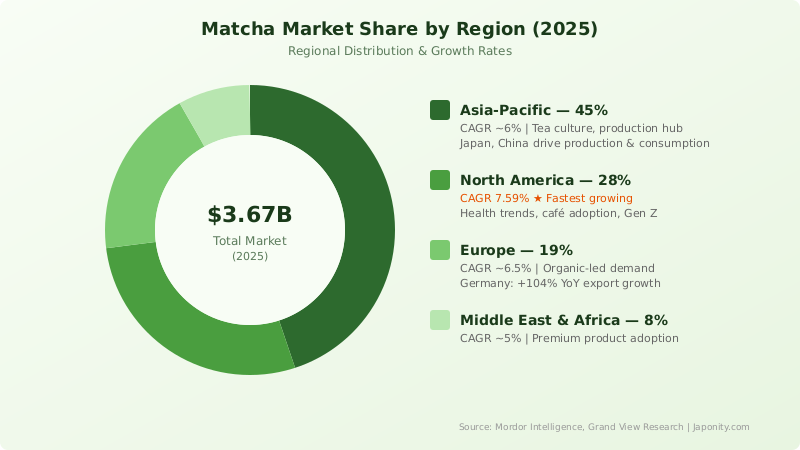
| Asia-Pacific | 44.6–51.2% | ~6% | Tea culture tradition, production base, domestic consumption in Japan/China |
| North America | ~28% | 7.59% | Health trends, café adoption, plant-based diet alignment |
| Europe | ~19% | ~6.5% | Organic demand, favorable tea trade regulations |
| Middle East & Africa | ~8% | ~5% | Rising premium product adoption |
Source: Mordor Intelligence, Grand View Research
North America: The Fastest-Growing Market
North America is the fastest-growing regional market with a projected CAGR of 7.59%. The United States alone accounts for the majority of Japan’s matcha exports—approximately $88 million in 2024. Major coffee chains including Starbucks, Dunkin’, Blank Street, and Peet’s Coffee have all integrated matcha into their permanent menus.
However, new 15% tariffs on Japanese imports into the United States are adding pricing pressure. The average matcha latte now costs $6.15 per cup, up from $5.84 the previous year.
Europe: Organic-Led Growth
Germany has emerged as a surprising matcha powerhouse, with export growth of 103.93% year-on-year to become Japan’s second-largest matcha export destination. European demand is heavily driven by organic certification—consumers and retailers increasingly require USDA Organic or EU Organic labels.
Southeast Asia: The Emerging Frontier
Malaysia and Thailand have entered the top 5 export destinations for Japanese matcha, reflecting rapid matcha adoption driven by Japanese café chains expanding across the region and growing demand for premium matcha sweets.
4. Japan’s Matcha Export Boom—and Its Limits
Export Growth Trajectory
| Year | Green Tea Export Value (JPY) | Export Volume | Key Milestone |
|---|---|---|---|
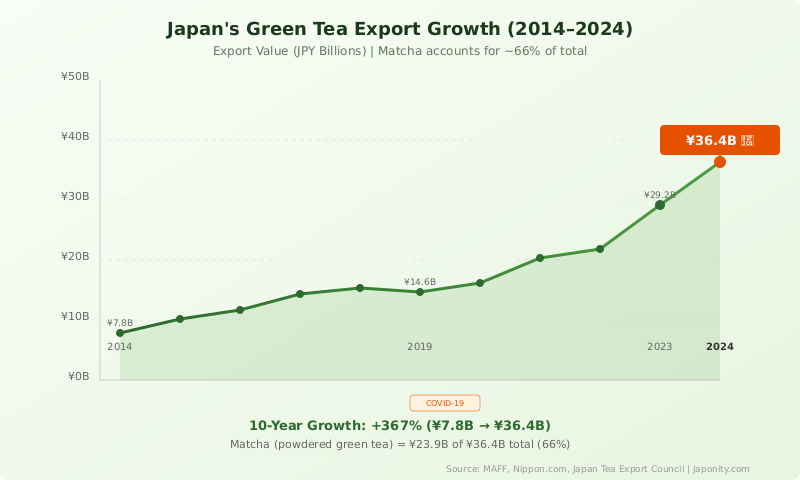
| 2014 | ~¥7.8B | ~2,900t | Export promotion begins |
| 2019 | ~¥14.6B | ~5,100t | Pre-COVID peak |
| 2023 | ~¥29.2B | ~7,500t | Post-COVID recovery surge |
| 2024 | ¥36.4B | ~8,798t | All-time record; exceeded ¥31.2B government target early |
Of the ¥36.4 billion in 2024 green tea exports, powdered green tea (matcha) accounted for ¥23.9 billion—approximately 66% of total export value. Japan exported 5,092 tons of matcha in 2024, an 18.7% increase over the previous year.
Top Export Destinations (2024)
| Rank | Country | YoY Growth | Notes |
|---|---|---|---|
| 1 | United States | — | Largest market by far, café chain demand |
| 2 | Germany | +103.9% | Fastest-growing major market |
| 3 | Malaysia | — | Southeast Asian café expansion |
| 4 | Canada | — | Health-conscious consumer base |
| 5 | Thailand | — | Japanese F&B brand expansion |
Source: Tridge Japanese Matcha Export Market Analysis
Government Policy Shift
In April 2025, Japan’s Ministry of Agriculture (MAFF) released a landmark revised Basic Policy for Tea Industry Promotion, officially pivoting the tea industry’s strategic focus from domestic consumption to exports, with particular emphasis on tencha and organic tea production.
5. The 2025 Supply Crisis
What Happened
The global matcha boom collided with a perfect storm of supply constraints in 2025, creating the most severe supply crisis in modern matcha history.
Price Surge Data
| Metric | 2024 | 2025 | Change |
|---|---|---|---|
| Kyoto first-flush tencha (avg. price/kg) | ¥5,500 | ¥14,333 | +160% |
| Kyoto May auction tencha (avg. price/kg) | ¥3,050 | ¥8,235 | +170% |
| Kyoto overall tea transaction price | — | — | +150% (2.5x) |
| US matcha latte (avg. price/cup) | $5.84 | $6.15 | +5.3% |
Sources: Kyoto Shimbun, International Tea News, NBC News
Root Causes of the Crisis
1. Declining Farmer Population
Japan’s tea farming households have plummeted from over 54,000 in 2000 to approximately 20,000 today—a 63% decline. The average age of tea farmers continues to rise, with over 67% being aged 60 or above. Tea cultivation area has shrunk to approximately 36,000 hectares, down 25% from peak levels.
2. Climate Disruption
A cold spring in 2025 devastated first-flush harvests across major producing regions. Kyoto produced only 460 tons—87% of its 2024 volume. Nishio, Japan’s largest matcha-producing city, reported production down nearly 25%.
3. Reserve Depletion
During the 2024 matcha boom, many farmers depleted their reserves of tencha leaves to meet surging demand, leaving no buffer for the 2025 production shortfall.
4. Structural Time Lag
Tea is an agricultural product that requires a minimum of 5 years from planting to first harvest. Even with many farmers converting to tencha production, supply cannot respond quickly to demand spikes.
Industry Response
Major tea producers have announced significant price increases effective 2025:
- Ippodo Tea: Matcha products ~1.5x price increase
- Marukyu-Koyamaen: Price revisions across product lines
- Gion Tsujiri: Comprehensive pricing revisions citing industry-wide supply pressure
- Nakamura Tokichi: 1.5–1.6x for matcha products, 1.2–1.3x for other teas
6. The Social Media Engine
Social media has been the single most powerful demand accelerator for matcha globally.
Key Metrics
- TikTok: #matcha has surpassed 2 billion views as of mid-2025
- Instagram: #MatchaLover has approximately 1.55 million posts
- Consumer interest in matcha grew 19% year-on-year across social media platforms
- Searches for “flavored matcha drinks” climbed over 180% in Q3–Q4 2025
- Matcha menu items on foodservice platforms grew 30.22% YoY
Bloomberg reported that global matcha popularity, fueled by SNS and inbound tourism, has created supply shortages within Japan itself—an ironic situation where the producing country cannot meet its own domestic demand.
Gen Z: The Core Growth Demographic
Gen Z has transformed matcha from a traditional Japanese drink into a lifestyle aesthetic. TikTok creators have built entire online personas around ceremonial matcha, with daily “matcha check” videos, and influencers collaborating with brands to release limited-edition kits with branded whisks, scoops, and glass mugs.
7. Science-Backed Health Benefits
Matcha’s health credentials are not merely marketing claims—they are supported by peer-reviewed scientific research.
Key Bioactive Compounds
| Compound | Amount in Matcha | Key Benefits |
|---|---|---|
| EGCG (Epigallocatechin gallate) | 137x more than standard green tea | Antioxidant, anti-inflammatory, potential anti-cancer properties |
| L-Theanine | 6.1 mg/L – 44.65 mg/g | Calm focus, stress reduction, improved cognitive function |
| Caffeine | ~70mg per cup | Sustained energy without jitters (modulated by L-theanine) |
| Catechins (EC, ECG, EGC, EGCG) | High concentration | Cardiovascular protection, metabolic support |
Evidence Summary
| Health Area | Evidence Level | Key Findings |
|---|---|---|
| Cognitive Function | Strong (human studies) | Improved attention, memory, and reaction time |
| Cardiovascular Health | Strong (human studies) | Lower blood pressure, reduced inflammation |
| Antioxidant Activity | Very strong | Highest antioxidant capacity among common teas |
| Cancer Prevention | Preliminary (lab/animal) | EGCG shows anti-cancer properties; more human studies needed |
| Metabolic Health | Moderate | Potential benefits for fat oxidation and weight management |
Sources: PMC: Health Benefits and Chemical Composition of Matcha, PMC: Therapeutic Potential of Matcha Tea
Safe daily intake is approximately 4g of matcha (2 level teaspoons), providing around 338mg of catechins and EGCG.
8. Consumer Trends and Innovation
Café and Foodservice
Matcha has firmly established itself in the global café landscape. Costa Coffee launched its first-ever full matcha range in 2026, while Blank Street built a $500M brand largely around flavored matcha drinks. In Japan, Starbucks launched a sencha-matcha fusion line in April 2026.
Product Innovation Trends
| Trend | Examples | Growth Signal |
|---|---|---|
| Flavored Matcha | Vanilla matcha latte, lavender matcha | 7.26% CAGR through 2031 |
| RTD (Ready-to-Drink) | Canned matcha, cold brew matcha | Fast retail and foodservice growth |
| Functional Blends | Matcha + collagen, adaptogens, mushrooms | Wellness-focused innovation |
| Plant-Milk Pairing | Oat milk × matcha | Core café combination trend |
| Matcha Desserts | Tiramisu, croissants, soft serve | Expanding beyond traditional sweets |
| Supplements | Matcha protein powder, capsules | Fitness-oriented consumer segment |
Distribution Channels
Online retail commands 41.10% of 2025 revenue, reflecting consumer trust in direct-to-consumer authenticity assurances. This is particularly important for matcha, where quality verification and origin traceability are key purchasing factors.
9. Competitive Landscape
Key Industry Players
| Category | Companies | Market Position |
|---|---|---|
| Japanese Heritage Producers | Marukyu-Koyamaen, Ippodo Tea, Aiya (Nishio) | Premium supply, ceremonial grade expertise |
| Japanese Beverage Giants | ITO EN, AOI Tea Company | Scale production and distribution |
| Global F&B Corporations | Nestlé, Tata Global Beverages, Lipton | Mass-market distribution power |
| D2C Disruptors | Encha, Tenzo Tea, Isshiki Matcha | Digital-first, community-driven brands |
| Café Chains | Starbucks, Dunkin’, Blank Street, PepsiCo | Distribution scale and consumer access |
Source: Grand View Research, Future Market Insights
China: The Rising Competitor
By 2025, China’s matcha production exceeded 5,000 tons, approaching Japan’s annual output. However, there remains a significant gap in export value—Japan commands premium pricing at an average of $36.31/kg, while Chinese matcha competes primarily on volume at lower price points.
10. Business Opportunities and Risks
Opportunity Matrix
| Opportunity | Target Market | Entry Barrier | Potential |
|---|---|---|---|
| Premium D2C Brand | Health-conscious consumers in NA/EU | Medium (sourcing, branding) | High |
| B2B Ingredient Supply | Cafés, food manufacturers | High (volume, certification) | Very High |
| Flavored/RTD Products | Gen Z, mainstream consumers | Medium (formulation, distribution) | High |
| Organic Certified Matcha | European market | High (certification process) | High |
| Matcha Café Franchise | Urban areas in NA/EU/SEA | High (capital, operations) | Medium-High |
Key Risks
| Risk | Severity | Mitigation |
|---|---|---|
| Supply Shortage | Critical | Diversify sourcing (Kagoshima, organic farms); long-term contracts |
| Price Volatility | High | Hedging strategies; multi-grade product lines |
| Tariff Risk (US) | Medium-High | Inventory management; explore non-Japanese origins for lower grades |
| Quality Fraud | Medium | Direct sourcing relationships; origin certification |
| Trend Fatigue | Low-Medium | Focus on health/science messaging over trend-driven marketing |
11. Outlook: What Comes Next?
Short-Term (2026–2028)
- Supply will remain tight. New tencha plantings from 2025 won’t yield meaningful harvests until 2030+
- Prices will stay elevated, with premium ceremonial grades potentially becoming scarce for export
- China will increase market share in the culinary/industrial segments, competing on price
- Flavored matcha and RTD products will drive mainstream adoption in Western markets
Medium-Term (2028–2032)
- Market consolidation as smaller brands struggle with sourcing; larger players with direct farm relationships will have a competitive advantage
- New production regions (Kagoshima expansion, potential overseas cultivation) will gradually ease supply pressure
- Functional matcha blends will create new product categories beyond traditional tea
- Japan’s government export strategy will drive increased organic and tencha production capacity
Long-Term (2032+)
- The market is projected to reach $7–11 billion if current growth trajectories hold
- Matcha will be established as a permanent fixture in global beverage culture—not a passing trend
- Quality differentiation between Japanese premium matcha and mass-market alternatives will widen, creating a two-tier global market
Methodology and Sources
This report synthesizes data from the following categories of sources:
- Government Statistics: Japan Ministry of Agriculture (MAFF), e-Stat Japan
- Market Research: Mordor Intelligence, Grand View Research, SNS Insider, Future Market Insights
- Scientific Research: PubMed Central (PMC)
- Trade Data: Tridge, JETRO, Japan Tea Export Promotion Council
- Industry News: Nippon.com, Bloomberg, NBC News, Kyoto Shimbun
This report was researched and produced by Japonity.com — Japan Discovery & Business Intelligence Platform.
Need a custom market research report on Japanese industries, companies, or products? We accept commissioned research projects (調査代行). Contact us to discuss your specific intelligence needs.
Published: April 2026 | Data current as of March 2026
Interested in Japanese business opportunities?
Whether you're looking for technology partners, engineering talent, or market insights — we can help connect you with the right Japanese organizations.
Get in Touch →